
Introduction
The performance impact of real user monitoring (RUM) based traffic steering is a hot topic in site reliability engineering and other disciplines concerned with application performance. NS1 offers RUM steering within our managed DNS service so we thought it would be interesting to set up a controlled experiment to measure the performance impact of using Pulsar vs more traditional DNS traffic steering. This article describes the set up and results. But before diving into that, here is a brief explanation of Pulsar and RUM steering.
Pulsar is NS1’s Real User Monitoring (RUM) DNS traffic steering capability. Pulsar takes in millions of RUM data points, which are round trip time (RTT) measurements from the browsers of real users to server end points. This generates a data base of the latency from almost every geolocation and network ASN to those server end points. When a new user makes a DNS request for one of those end points, our DNS uses Pulsar to select the end point with the lowest latency for that user - and take more RTT measurements from that user’s browser which keeps Pulsar fed with more data.
Customers can instrument their own websites to collect those measurements from their own users. That is easy to do by embedding a small javascript on their website. That is what we call the “Bring Your Own Data” (BYOD) model. Pulsar also has tons of “community data” which are RTT measurements to most major CDNS and AWS, contributed by our partners. This makes it easy for other NS1 customers that host with those providers to use RUM steering if the “BYOD” model does not work for them.
The value of RUM steering is it can identify problems that can be quite localized and/or temporary, and prevent users from being impacted by steering them to a better location. To demonstrate the difference RUM steering can make, I set up an experiment to compare Pulsar vs DNS round robin routing (shuffle) between four major CDNs (Akamai, Fastly, Cloudflare, and Highwinds). The third-party monitoring company Catchpoint was used to simultaneously test both a Pulsar and a shuffle routed domain from a globally distributed set of test nodes.
This experiment showed that the Pulsar enabled domain exhibited on average 26% lower mean RTT values than the domain using round robin DNS routing. Pulsar demonstrated improvements in the mean, standard deviation, median, 90th, and 95th percentile round trip times (RTT) across all five nodes tested. The diagram below shows the summary results. The remainder of this blog article gets into the details of the set up as well as shows more of the data that was collected. The full report is available in the resources section of our website.

The Merits of Synthetic Monitoring To Test RUM Steering
One of the challenges in conducting this type of test is how to independently measure the results. We decided to use synthetic monitoring because it can provide a highly controlled group of timed web requests from a geographically diverse set of endpoints. We understand that synthetic monitoring has its limitations such as: missing most networks (nodes only in a couple of networks), missing most geographies (nodes contained in a couple of geographies), and not testing page loads under real user conditions [1]. However, just because it provided a limited set of measurements taken from just a few locations does not mean that we cannot draw any conclusions from synthetic monitoring. The measurements we took are samples from which we can make reasonable inferences about the performance differences in general when evaluating the impact of RUM steering.
Experimental Setup
The experiment was setup with two domains: pulsar.frazao.ca and not-pulsar.frazao.ca which direct traffic using Pulsar and round robin DNS (Shuffle) respectively. When a request is made for either domain one of four CDN endpoints (Fastly, Akamai, Cloudflare, and Highwinds) is chosen depending on the DNS routing. Catchpoint was used to monitor these two domains from five globally distributed nodes for 48 hours.
These four CDNs were chosen as they are all being high quality CDNs that a company might use together in some configuration. Some NS1 customers do route to multiple CDN endpoints using a simple Shuffle Filter since it is often not obvious how to otherwise route user traffic to a globally anycasted CDN. Figure 1 shows a typical setup.
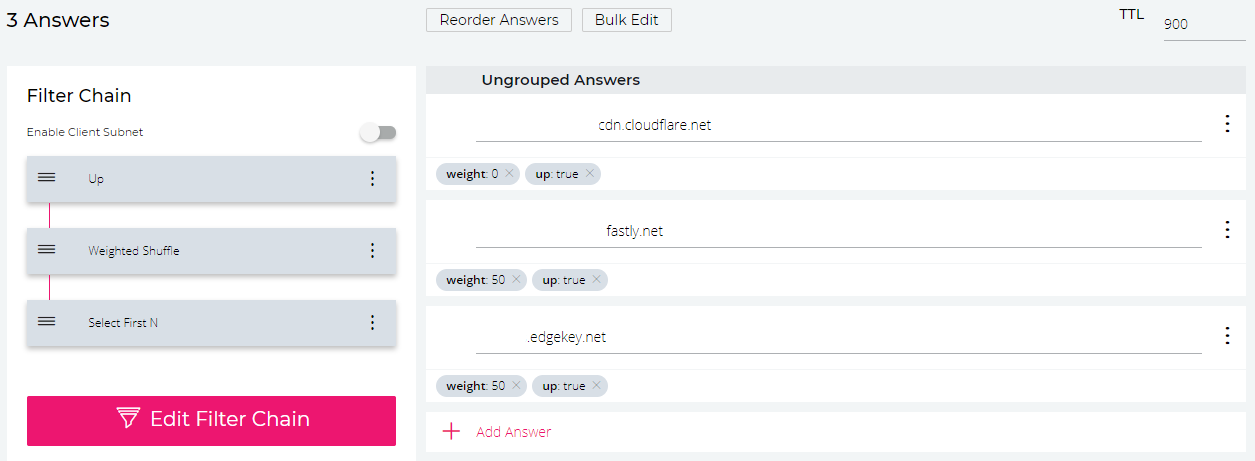
FIGURE 1: EXAMPLE USING SHUFFLE TO ROUTE TO Multiple CDNS
The DNS Setup
We configured two domains: pulsar.frazao.ca (Pulsar routed – the experimental group) and not-pulsar.frazao.ca (not Pulsar routed – the control group). These domains route the user to retrieve a 1x1 pixel at one of four CDNs: Akamai, Fastly, Cloudflare, or Highwinds. The Pulsar enabled record utilized Pulsar for the routing while the non-Pulsar enabled record used round robin DNS (NS1’s Shuffle Filter) to randomly choose between each of the 4 CDNs.
Two CNAME records were configured, pulsar.frazao.ca - CNAME and not-pulsar.frazao.ca – CNAME each with the same four answers: fastly.frazao.ca, akamai.frazao.ca, cloudflare.frazao.ca, and highwinds.frazao.ca. Each one of these four answers subsequently gave the user the IP address for a different EC2 server. This setup is demonstrated in figure 2 below.
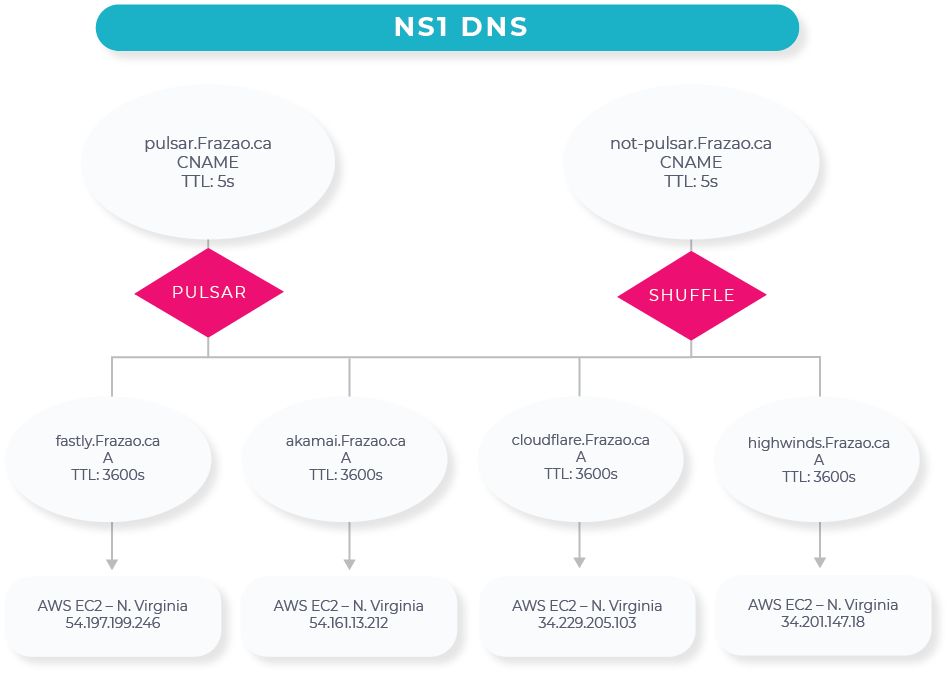
FIGURE 2: EXPERIMENT DNS SETUP
Webserver Setup
Four webservers were setup on four separate AWS EC2 Instances. Each webserver was configured to accept the host header of either pulsar.frazao.ca or not-pulsar.frazao.ca and to subsequently redirect the requester to one of the four CDNs (e.g., fastly.frazao.ca will redirect to the pixel hosted on Fastly).
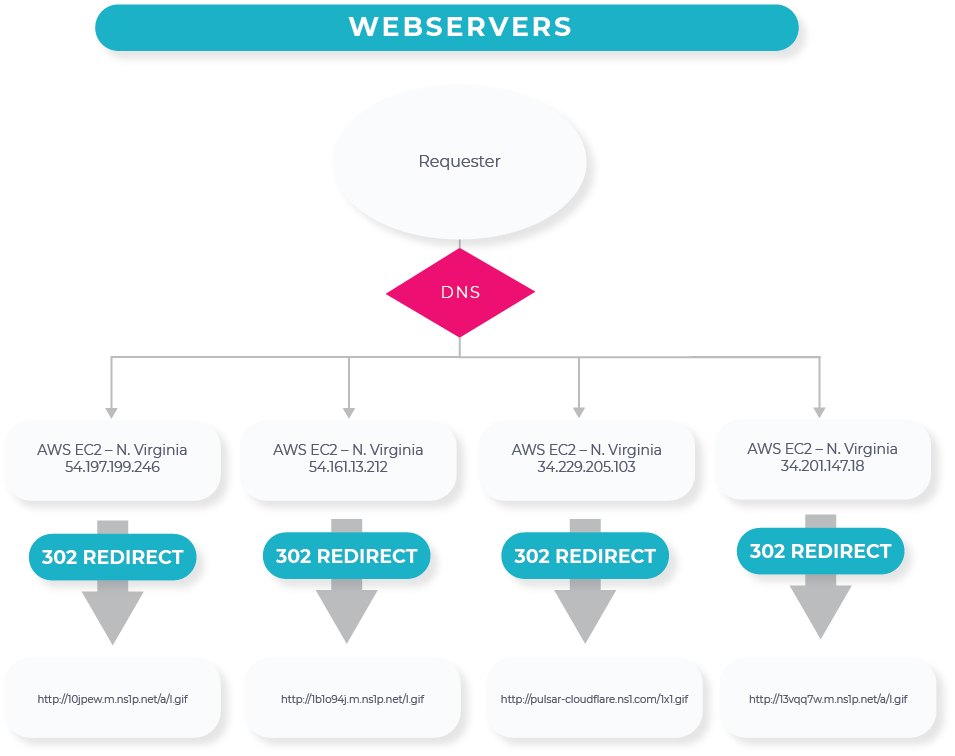
FIGURE 3: EXPERIMENT WEBSERVER SETUP
Apache was used as the webservers on these EC2 instances and the redirects were accomplished via a line in the virtual host conf file.
Catchpoint Monitoring
The Catchpoint tests setup for this experiment were designed to control for as many variables as possible so that we are only testing the effectiveness of Pulsar and not some other factor that we did not control for. To this end two Catchpoint tests were setup to measure both pulsar.frazao.ca and not-pulsar.frazao.ca simultaneously from the same five nodes.
The “Object” monitor type was used, with a five-minute frequency, running the tests concurrently from five nodes (Paris – Cogent, New York – Level3, Johannesburg – Vox, Tokyo – SoftLayer, and Sao Paulo - AWS). These two tests were run for 48 hours.
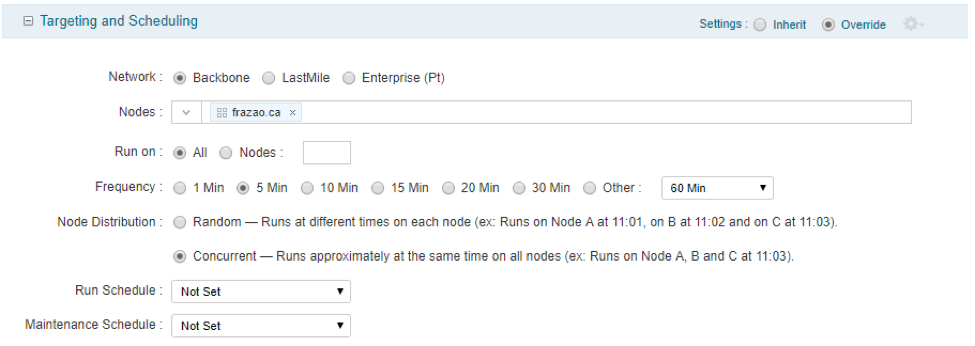
FIGURE 5: TARGETING AND SCHEDULING CATCHPOINT TEST SETTINGS
Results & Analysis
Approximately 5,750 runs were conducted by Catchpoint from the five nodes (~2,880 runs per domain). All analysis was conducted using Python and Jupyter Notebooks which is available for review upon request. On average the Pulsar enabled domain had a round trip time of 355ms while the non-Pulsar domain had a round trip time of 477ms. On average the Pulsar domain was 122ms (26%) faster than the domain that did not have Pulsar enabled. The Pulsar enabled domain also exhibited a smaller standard deviation in the RTT and had smaller RTT values at all percentiles tested.
Metric | Pulsar | Non-Pulsar (Shuffle) |
Mean | 354.91 ms | 476.89 ms |
Standard Deviation | 284.52 ms | 393.22 ms |
50th Percentile | 334.00 ms | 417.00 ms |
90th Percentile | 548.60 ms | 894.10 ms |
95th Percentile | 653.60 ms | 1056.1 ms |
This observation remained true at every node that was tested where the mean RTT for Pulsar outperformed Shuffle by as much as 181ms (32%) in one instance. In all other statistics examined (standard deviation, median, 90th percentile, and 95th percentile) Pulsar outperformed Shuffle.
| µ | σ | Pulsar p50 | p90 | σ | Shuffle p50 p90 | |||
All stats in ms | p95 | µ | p95 | ||||||
Paris FR - Cogent | 378 | 458 | 250 | 667 | 835 | 559 | 527 | 450 944 | 1055 |
Johannesburg ZA - Vox | 546 | 128 | 512 | 614 | 741 | 696 | 254 | 545 1070 | 1091 |
Tokyo JP - Softlayer | 413 | 124 | 369 | 525 | 625 | 557 | 313 | 461 818 | 1045 |
Sao Paulo BR - AWS | 319 | 109 | 307 | 350 | 376 | 440 | 262 | 337 695 | 719 |
New York - Level3 | 118 | 234 | 57 | 242 | 348 | 132 | 290 | 69 265 | 358 |
FIGURE 7: AVERAGE RTT BY NODE
Next Steps
This experiment’s results suggest that Pulsar provides significant advantage over round robin routing for multi-endpoint domains, especially outside of North America. As discussed earlier in the paper, there are some potential problems with using synthetic testing for measuring end user experience, so it would be valuable to reproduce this experiment with many more nodes, over a longer time horizon. Alternatively, we could also try to reproduce this experiment using Catchpoint’s “Last Mile” tests to provide better representation of end user networks and see if the results hold.
I believe that the most interesting claim to test would be the efficacy of Pulsar vs geographical routing where either:
- Certain CDNs are chosen as defaults for a given geographical area – would there be a benefit from using Pulsar in this case (e.g., I have access to Akamai, Cloudflare, and Highwinds, but in Brazil I only use Highwinds)
- Efficacy of Pulsar versus endpoints with unicast known geographical endpoints (e.g., Is there any reason to use Pulsar to route AWS East 1 vs West 1)
I documented all of the results of this experiment in a paper that is posted on our website. So if you want to see more of the data gathered in the tests we ran, you can download the paper here.