NS1 has updated our portal to improve your online experience. The monitoring feature received a lot of attention during this round of updates. There are changes to the monitor creation, notification, and data history views in the portal. We’ve included some screen shots to give you a feel for the new items in the portal itself.
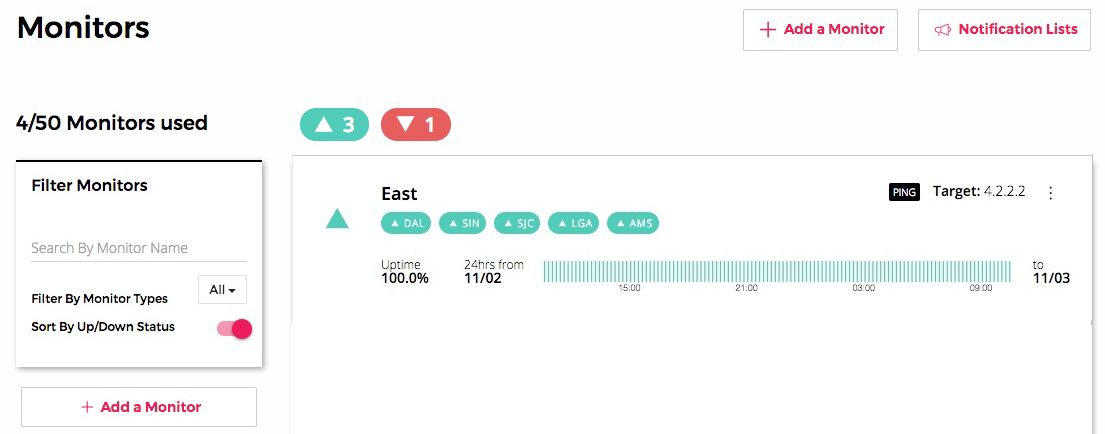
On the main portal view, one of the most obvious change is that the icons (up / down indicators for each monitored object) are now simpler and clearer images. Their smaller size allows for other information to be included in the view. We’ve also upgraded the histogram graphs. The solid graph status bar is now a row of individual marks showing green for up and red for down. This graph type shows the most recent 24 hours in a glance and gives you more insight into the history of the object.
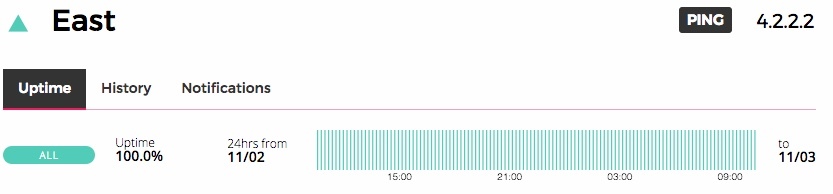
Click the monitor name, East in this example, to view in the details page. The menu tabs, Uptime, History, and Notifications each open a new view. Uptime is the default. It displays the past 24 hour histogram, also visible on the main page, along with the configuration section.
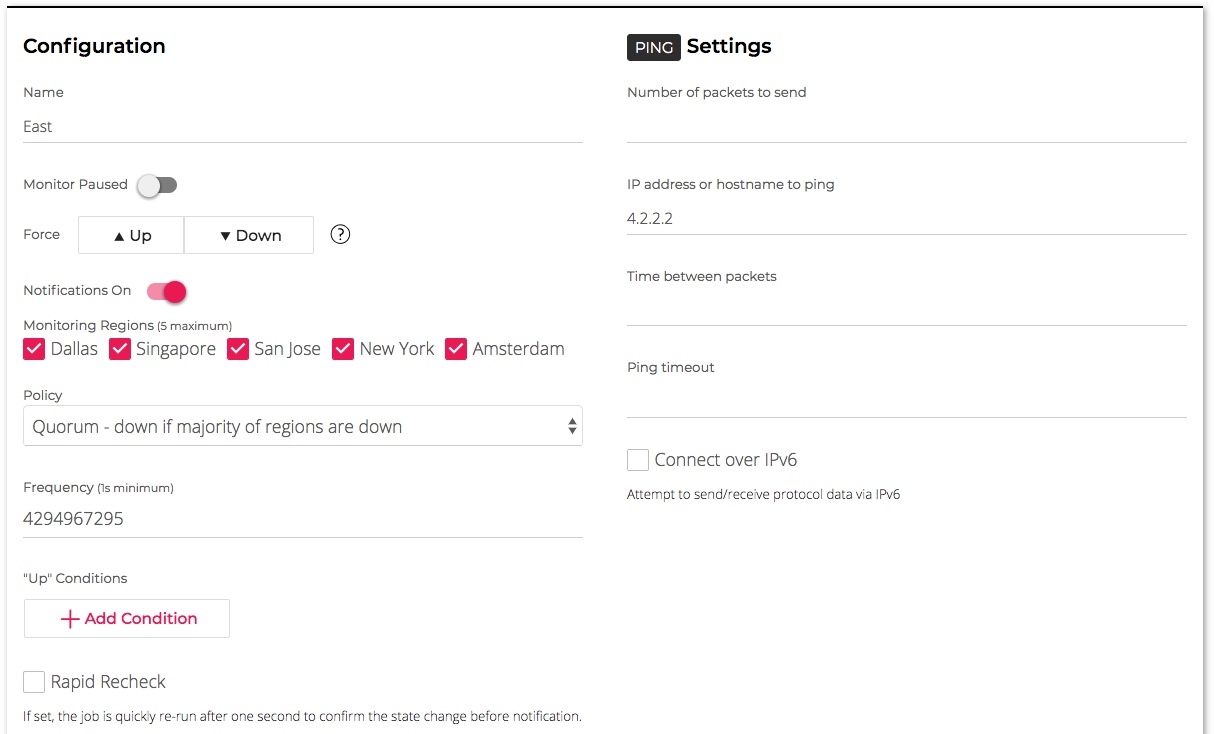
This example of the configuration and settings is for a PING monitor. The monitor view also supports TCP, DNS, and HTTP monitor types. Note the “Connect over IPv6” in the lower right corner, this is now available for each monitor type. Monitors connect to their targets using IPv4 by default. Use this new feature to choose to monitor via IPv6 connections. In the left column just above the Monitoring Regions are two new switches. They are labelled “Monitor Paused”, and "Force Up/Down". You can silence monitoring notifications by moving the Monitor Paused switch to the right. This can be especially helpful if you’ve identified an issue and are working on its solution, but you don’t want to be distracted with new notifications that may arrive. Sliding the switch to the left will restart notifications for the monitor.
The Force Up/Down switches let you control how an endpoint is viewed, regardless of the health monitor status. If a health check is failing but you still want to send traffic to that endpoint, select Force Up to keep sending traffic to the endpoint. On the other hand, if an endpoint is healthy and the monitor shows it as up, you can use Force Down to stop sending traffic to the endpoint. This will drain traffic away from the endpoint. A handy tool in a situation where you need the endpoint clear of all traffic, such as a maintenance window that will require a reboot.
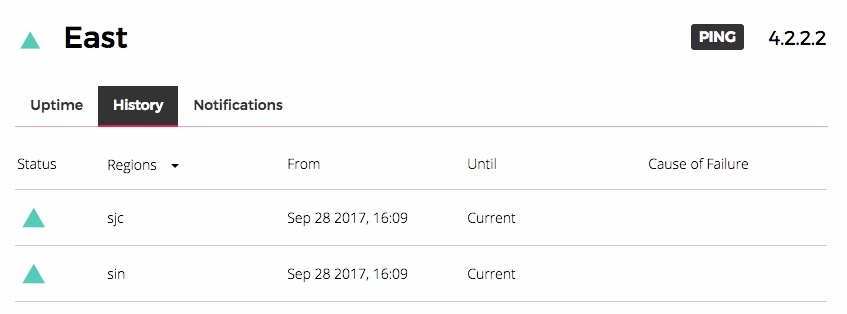
Clicking the History menu tab displays the chart of outage measurements with columns titled: Status, Regions, Start Date/Time, End Date/Time, and Cause of Failure. The Regions column header in the History chart opens a multi-select list of all regions. Click all regions, or click one or more specific regions to view.
The Cause of Failure column is one of the most useful new features in the monitor interface. If a failure is identified, this column will display information about the failure. This information may identify a rule set that failed, a DNS lookup failure, connection failures, or timeout failures. In the event of a failure, it should give your network techs a good place to begin troubleshooting.
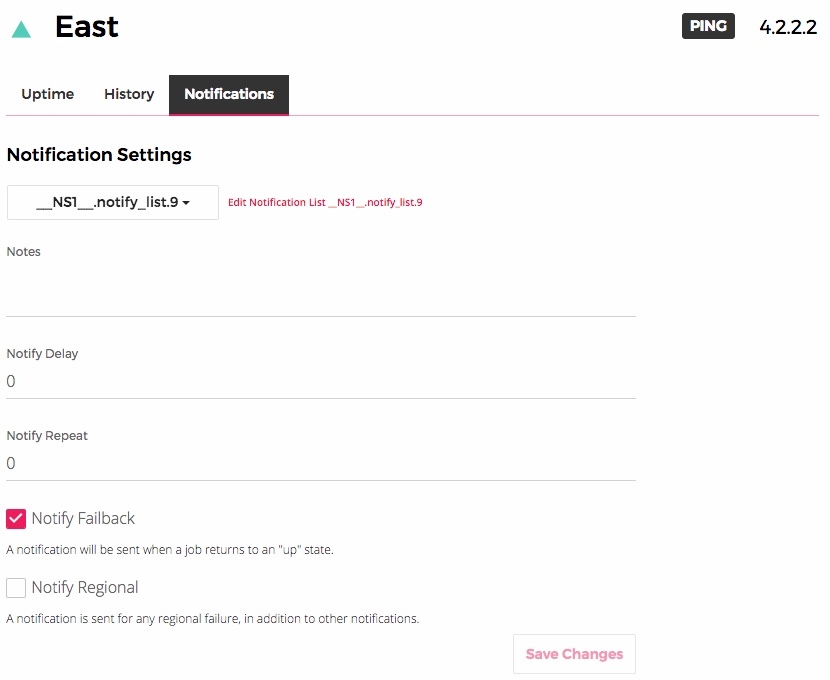
Clicking the Notifications menu tab shows the notification settings. To edit the notifications list: click the link to the right of the Notification name field. In this example, the link is Edit: Notification List_NS1_notify_list.9. Other fields in this view can be edited on their own.
We hope you like the portal changes as much as we do. At NS1 we spend every day building a smarter internet and trying to make your experience better. If you have any questions or comments about our new portal look, we’d love to hear from you.